AtlasDemography, Growth, and CommutingManuela Foscaldi and Carla Ringenbach
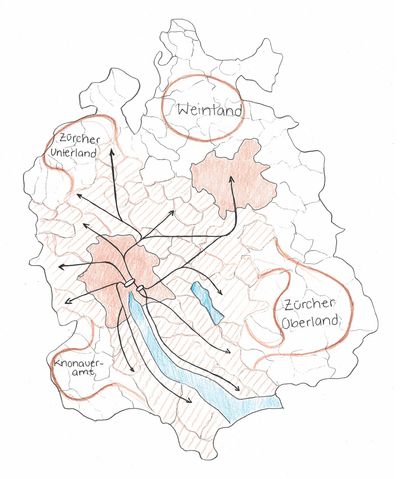
In the Canton of Zurich, the population has grown strongly over the past ten years. This growth has spread from the cities of Winterthur and especially Zurich to the neighboring regions. As a country that has always been strongly influenced by migrants, Switzerland is growing primarily because of them. They account for a large part of the growth. It is no longer just construction workers from southern Europe, but also highly qualified professionals like north European who contribute to population growth. The population is changing and constantly recomposing itself, where by the distribution within the canton appears to be comprehensible. For example, highly qualified people settle along Lake Zurich. This pull effect that the canton seems to have certainly results from the attractive labor market, the cultural program and the strongly developed infrastructure. Thus, it seems that the community are growing primarily along the public transport network. The regions that are already well connected have grown strongly and have both good S-Bahn and bus connections. In the regions of Knonaueramt, Zürcher Oberland and Unterland, a certain growth trend can already be seen, which is reflected in the S-Bahn connection. Finally, Weinland, as the region with even communities with declining to moderate growth, is also the region that is rather strongly connected by bus and is more oriented towards Winterthur than Zurich.
Uneven Growth
Unequal Growth.
Source: Statistisches Amt, Canton of Zurich.
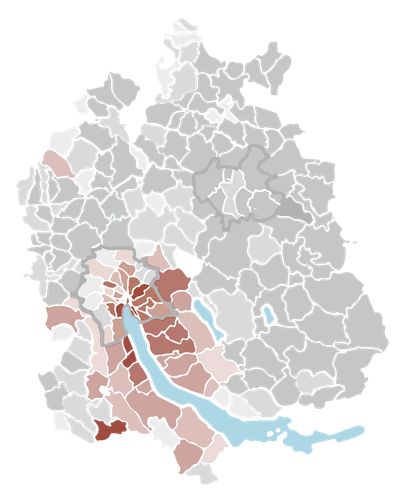
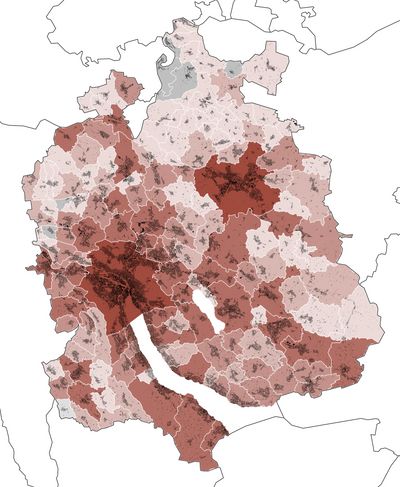
- 10,000–46,196 persons
- 1000–10,000 persons
- 600–1000 persons
- 300–600 persons
- 0–300 persons
- 0 persons
- < 0 persons
- Building fabric
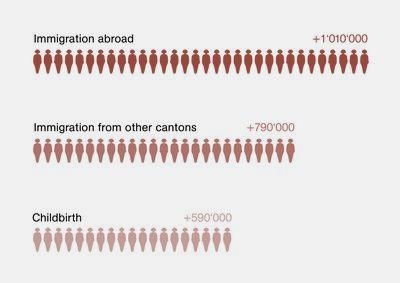
In the Canton of Zurich, the population has grown by an average of 1.2 % in each of the past ten years, this is more than the Swiss average. As expected, the largest cities Winterthur with approximately 12,000 people and the city of Zurich with even approximately 47,000 people have increased the most. The population is increasing from these two cores into the immediate agglomeration of the Glattal, Furttal and Limmattal. In addition, growth is taking place along the lakes of Lake Zurich in the Pfannenstiel and Zimmerberg regions as well as along the Lake Greifensee in the Glattal and Zurich Oberland regions. This latter development extends almost as a line further into the Zurich Unterland. In contrast, the population in the Weinland region has increased rather modestly in comparison and three community have even experienced a decline. The same applies to the Furttal, where two community have experienced also a decline. In the Knonaueramt region, everything is represented from strongly growing community to moderately growing and stagnating ones. The population growth is largely reflected in the building behaviour. A lot of building has been done in the community that have grown the most in the past 10 years. However, due to the speculative construction market, construction was carried out regardless of population growth. The growth drivers are immigration from abroad, other cantons and the birth surplus.
Zurich Grows from Abroad
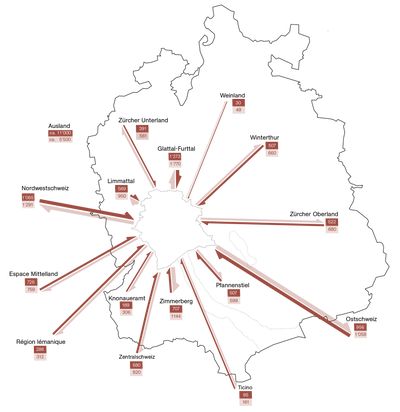
In– and outflows as an element of population development.
Source: Die Geografie der Umzüge bei Mietwohnungen.
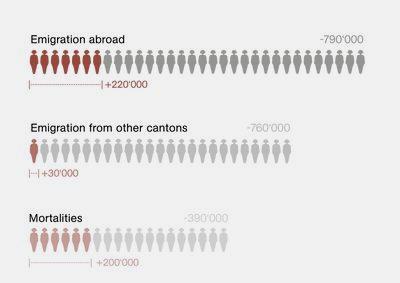
Zurich’s population is constantly changing due to different inflows and outflows. The most important drivers are immigration from abroad, from other cantons and the birth surplus. Migration gains are solely due to immigration from abroad. In contrast, the migration balance with other cantons and within the canton is balanced. Thus, the number of immigrants and emigrants is almost balanced.
Source: Statistisches Amt, Canton of Zurich.
Source: Statistisches Amt, Canton of Zurich.
The balance of immigrants and emigrants will change according to the cantonal forecast model. In 30 years, the total inflow of 2,390,000 people and the total outflow of 1,940,000 are expected to result in a plus of 450,000 more people in the Canton of Zurich.
Tell Me Where You Come From and I Tell You Where You Live

Foreign population by ethnic group.
Source: Statistisches Amt, Canton of Zurich.
- South Europe
- North Europe
- Southeast Europe
- West Europe
- East Europe and Russia
- Asia
- America and Oceania
- Africa
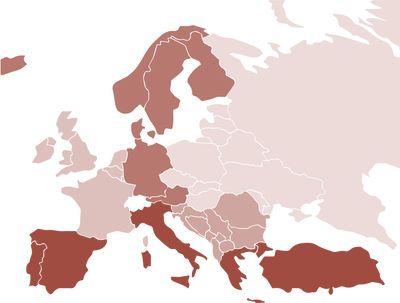
The foreign population, which is an important growth driver for the Canton of Zurich, has changed in its composition since 1990. Southern Europeans have consistently represented the largest share of the ethnicity mix. The northern Europeans have grown strongly since 1990. In addition, the share of southeast Europeans in the total population doubled at the turn of the century due to the civil war in former Yugoslavia. Thus, the ethnicity mix has become more heterogeneous, but the majority of the foreign population is still from a European country.
Source: Statistisches Amt, Canton of Zurich.

Source: Statistisches Amt, Canton of Zurich.
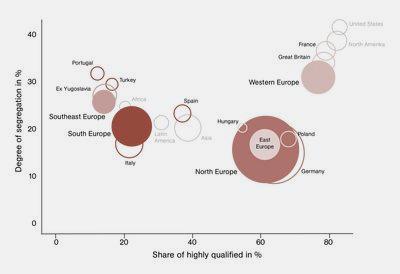
Like the population composition, the demographic distribution of the different nations is also diverse. Nevertheless, certain patterns can be deduced in connection with the level of qualification of the respective origin. For example, Western, Eastern and Northern Europeans settle more along Lake Zurich, as it is the group with the higher level of qualification and thus a higher income. However, Western Europeans show a higher degree of segregation than Eastern and Northern Europeans. On the other hand, South-eastern and Southern Europeans are more segregated. Especially in the agglomeration of the city of Zurich and in the city of Winterthur. These are groups with lower qualifications, which also have a higher degree of segregation. The Weinland and Knonaueramt regions, on the other hand, are not attractive locations for the foreign population. They are also the regions that have experienced moderate population growth or even decline.
Ageing Countryside
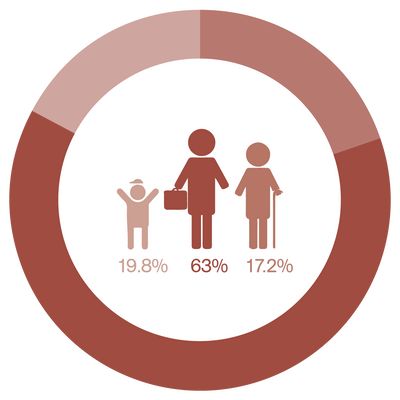
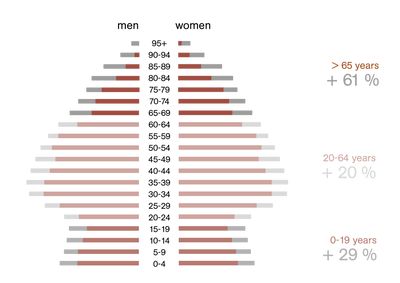
Population composition based on age.
Source: Statistisches Amt, Canton of Zurich.
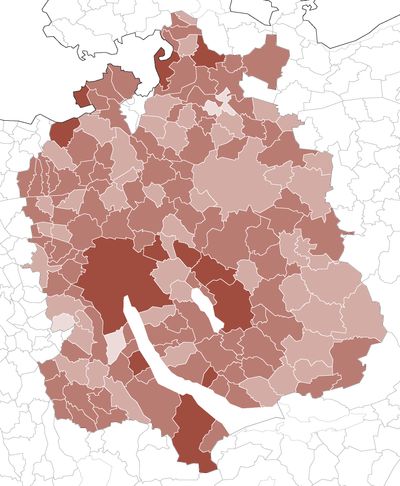
0–19 years.
Source: Statistisches Amt, Canton of Zurich.
- 25.5 %
- 21.5 %
- 17.5 %
- 13.5 %
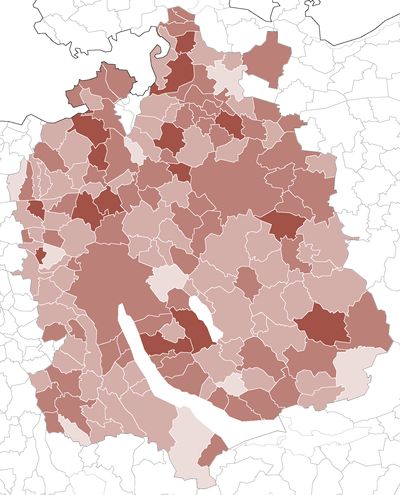
20–64 years.
Source: Statistisches Amt, Canton of Zurich.
- 68 %
- 64 %
- 60 %
- 54 %
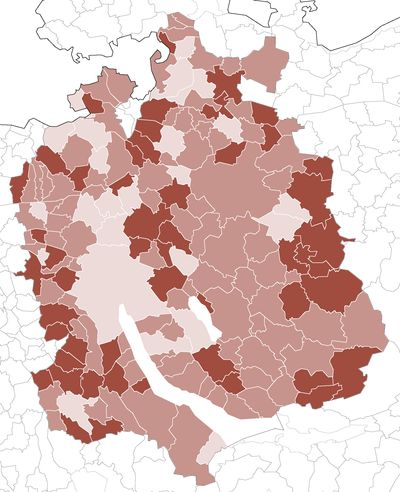
65+ years.
Source: Statistisches Amt, Canton of Zurich.
- 24 %
- 19 %
- 14 %
Migration flows change not only the number but also the composition and spatial distribution of the population. This spatial distribution does not follow any specific pattern, nor can a clear statement be made about a region of the Canton of Zurich. What is clear is that the population of the city of Zurich is a younger one, especially in contrast to Winterthur, where every age group seems to be represented in roughly equal numbers. Zurich owes its pull effect to its attractive labour market, cultural programm and generous infrastructure. The agglomeration also doesn´t seem to follow a obvious trend.
Source: Statistisches Amt, Canton of Zurich.
In the canton of Zurich, there are living slightly more women than men, as there are 99 men for every 100 women. However, there is an uneven distribution across the age groups. Men are more strongly represented in the 0-59 age group, but from the age of 60 onwards it is the other way round. This shift results on the one hand from the fact that more boys are born and slightly more men move to the Canton of Zurich and on the other hand the life expectancy of women is higher.
The weight of persons aged 65 and over will increase in future because the baby boomers are reaching the retirement age and life expectancy is rising. Thus, the population will also age in the Canton of Zurich, but at a comparatively moderate rate due to the immigration of young people.
Secular City and Christian Countryside
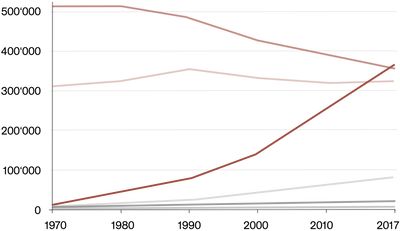
Development of the religious affiliation since 1970.
Source: Generalsekretariat, Canton of Zurich.
- Without confession
- Evangelical–Reformed
- Roman–Catholic
- Muslim
- Jewish
- Other Religions
While the various religious denominations have largely remained stable over the years, the proportion of non-denominationals has increased strongly, while the proportion of Evangelical-Reformed has decreased.
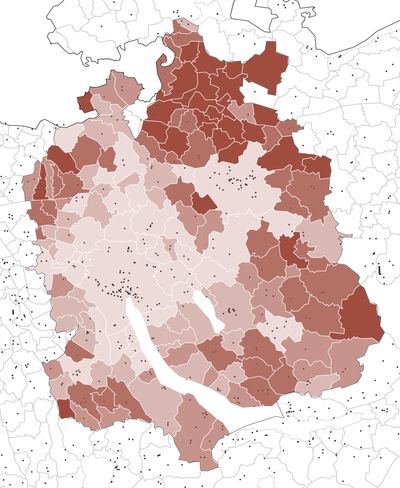
Distribution of Evangelical–Reformed and Roman–Catholic share.
Source: Statistisches Amt, Canton of Zurich.
- Religious buildings
- 63–74 %
- 57–63 %
- 54–57 %
- 50–54 %
- 34–50 %
In the Canton of Zurich, a clear pattern can be observed with a high proportion of non-denominational people. They are strongly represented in the city of Zurich, its agglomeration in the regions of Glattal, Furttal and Limmattal, as well as in the city of Winterthur, despite many sacred buildings. A larger proportion of believers is found in the Weinland, Knonaueramt, Zürcher Oberland and Unterland.
S-Bahn Metropolis
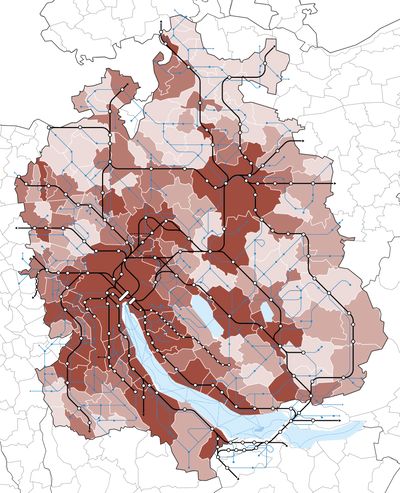
Public Transport Share with the S-Bahn and Bus Network.
Source: Statistisches Amt, Canton of Zurich.
Source: VBZ Zürich Line.
- 18–51 %
- 12–18 %
- 9–12 %
- 2–9 %
On average 57 % of the daily distance is covered by private motorized transport, 32 % by public transport and nine percent by walking, cycling and e-biking. Even though the private motorized transport still accounts for the most kilometers, Zurich’s population uses trains, buses and trams significantly more frequently than most other residents in Switzerland.
In the cities of Zurich and Winterthur, as well as in neighbouring regions such as Glattal, Pfannenstiel, Zimmerberg, Knonaueramt, Limmattal and Furttal, the distances travelled by public transport are high. Due to the centrally oriented S-Bahn network, there are mainly good public transport connections in the direction of the city and in the area close to the city. In the more rural regions, individual transport is preferred to the public bus network.
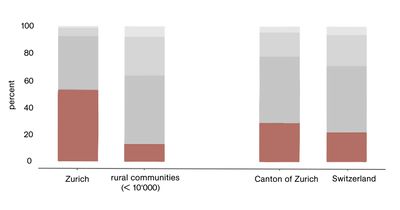
Car ownership by households in the Canton of Zurich and in Switzerland (2015).
Source: Statistisches Amt, Canton of Zurich
- no cars
- one cars
- two cars
- 3 and more cars
Almost a third of households in the Canton of Zurich do not have a car, which is above the Swiss average. The renunciation of one’s own car is particularly widespread in the large cities with good public transport connections as well as high frequencies. For example, households without a car have recently outnumbered those with a car in the city of Zurich. The contrast to the rural communities is great, as only a share of 12 % renounce a car. The majority owns a car and a third a second car.
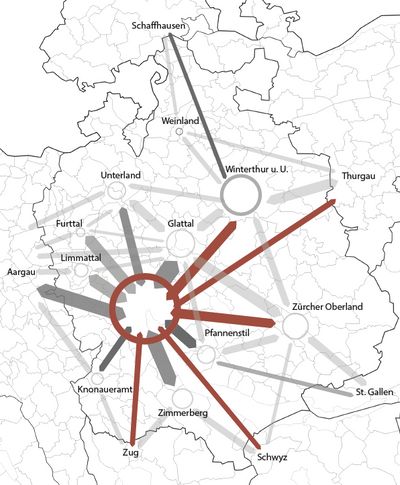
Gesamtverkehrskonzept, Canton of Zurich.
On radially oriented traffic connections with the city of Zurich, public transport is in the foreground as the primary mode of transport, while on tangentially oriented connections, especially those to neighboring cantons, private transport often dominates. The strongest radially oriented traffic flows are between the city of Zurich and the regions of Glattal, Zimmerberg and Limmattal, as well as supracantonally between the canton of Zurich and Aargau. Eastern Aargau is also closely intertwined tangentially with other regions of the Canton of Zurich.
In domestic traffic, public transport only reaches a high share in the city of Zurich. The daily distance traveled per inhabitant is lower in densely populated areas such as the cities of Zurich and Winterthur than in less densely populated areas.
Uneven Accessibility Patterns
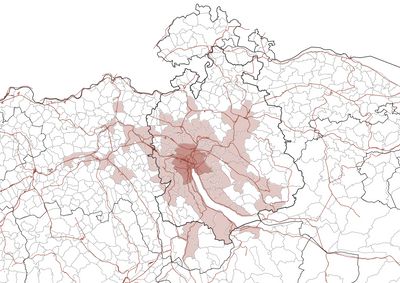
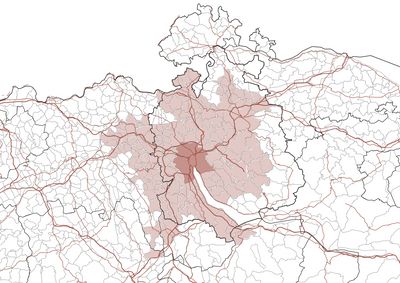

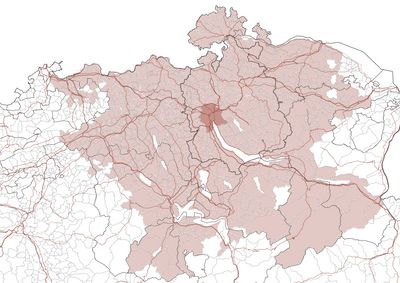
The catchment area of the car grows radially, while that of public transport grows tangentially along the train lines. Thus, within 60 minutes, cities such as Bern, Basel and Solothurn are accessible by train, but not by car. These cities on the map look like colored islands that can be reached in less time thanks to direct train connections. The node system of public transport hierarchizes the public transport routes and makes it possible to cover certain distances faster than others with shorter distances.
With the car, the catchment area grows evenly in all directions. One reason for this is the well-connected highway and road network. In terms of area, the radial catchment area of individual transport exceeds that of public transport, although the distance of the latter is greater.
